Understanding crypto charts is like learning a new language — but once you get it, you’ll make smarter trades and spot trends before they explode. This beginner’s guide will walk you through the key parts of a crypto chart, how to use TradingView, and which indicators actually matter.
📍 Why You Need to Read Charts (Even If You’re Not a Pro)
- ✅ Spot trends and price patterns
- ✅ Time your entries and exits better
- ✅ Avoid emotional FOMO trades
- ✅ Build confidence in your strategy
🧭 Meet Your Charting Tool: TradingView
- Built-in charts for every major crypto
- Live data from Binance, Coinbase, and more
- Free technical indicators and drawing tools
- Easy to set up alerts, watchlists, and even test strategies
Pro Tip: You don’t need to pay to get started. The free version of TradingView is perfect for beginners.
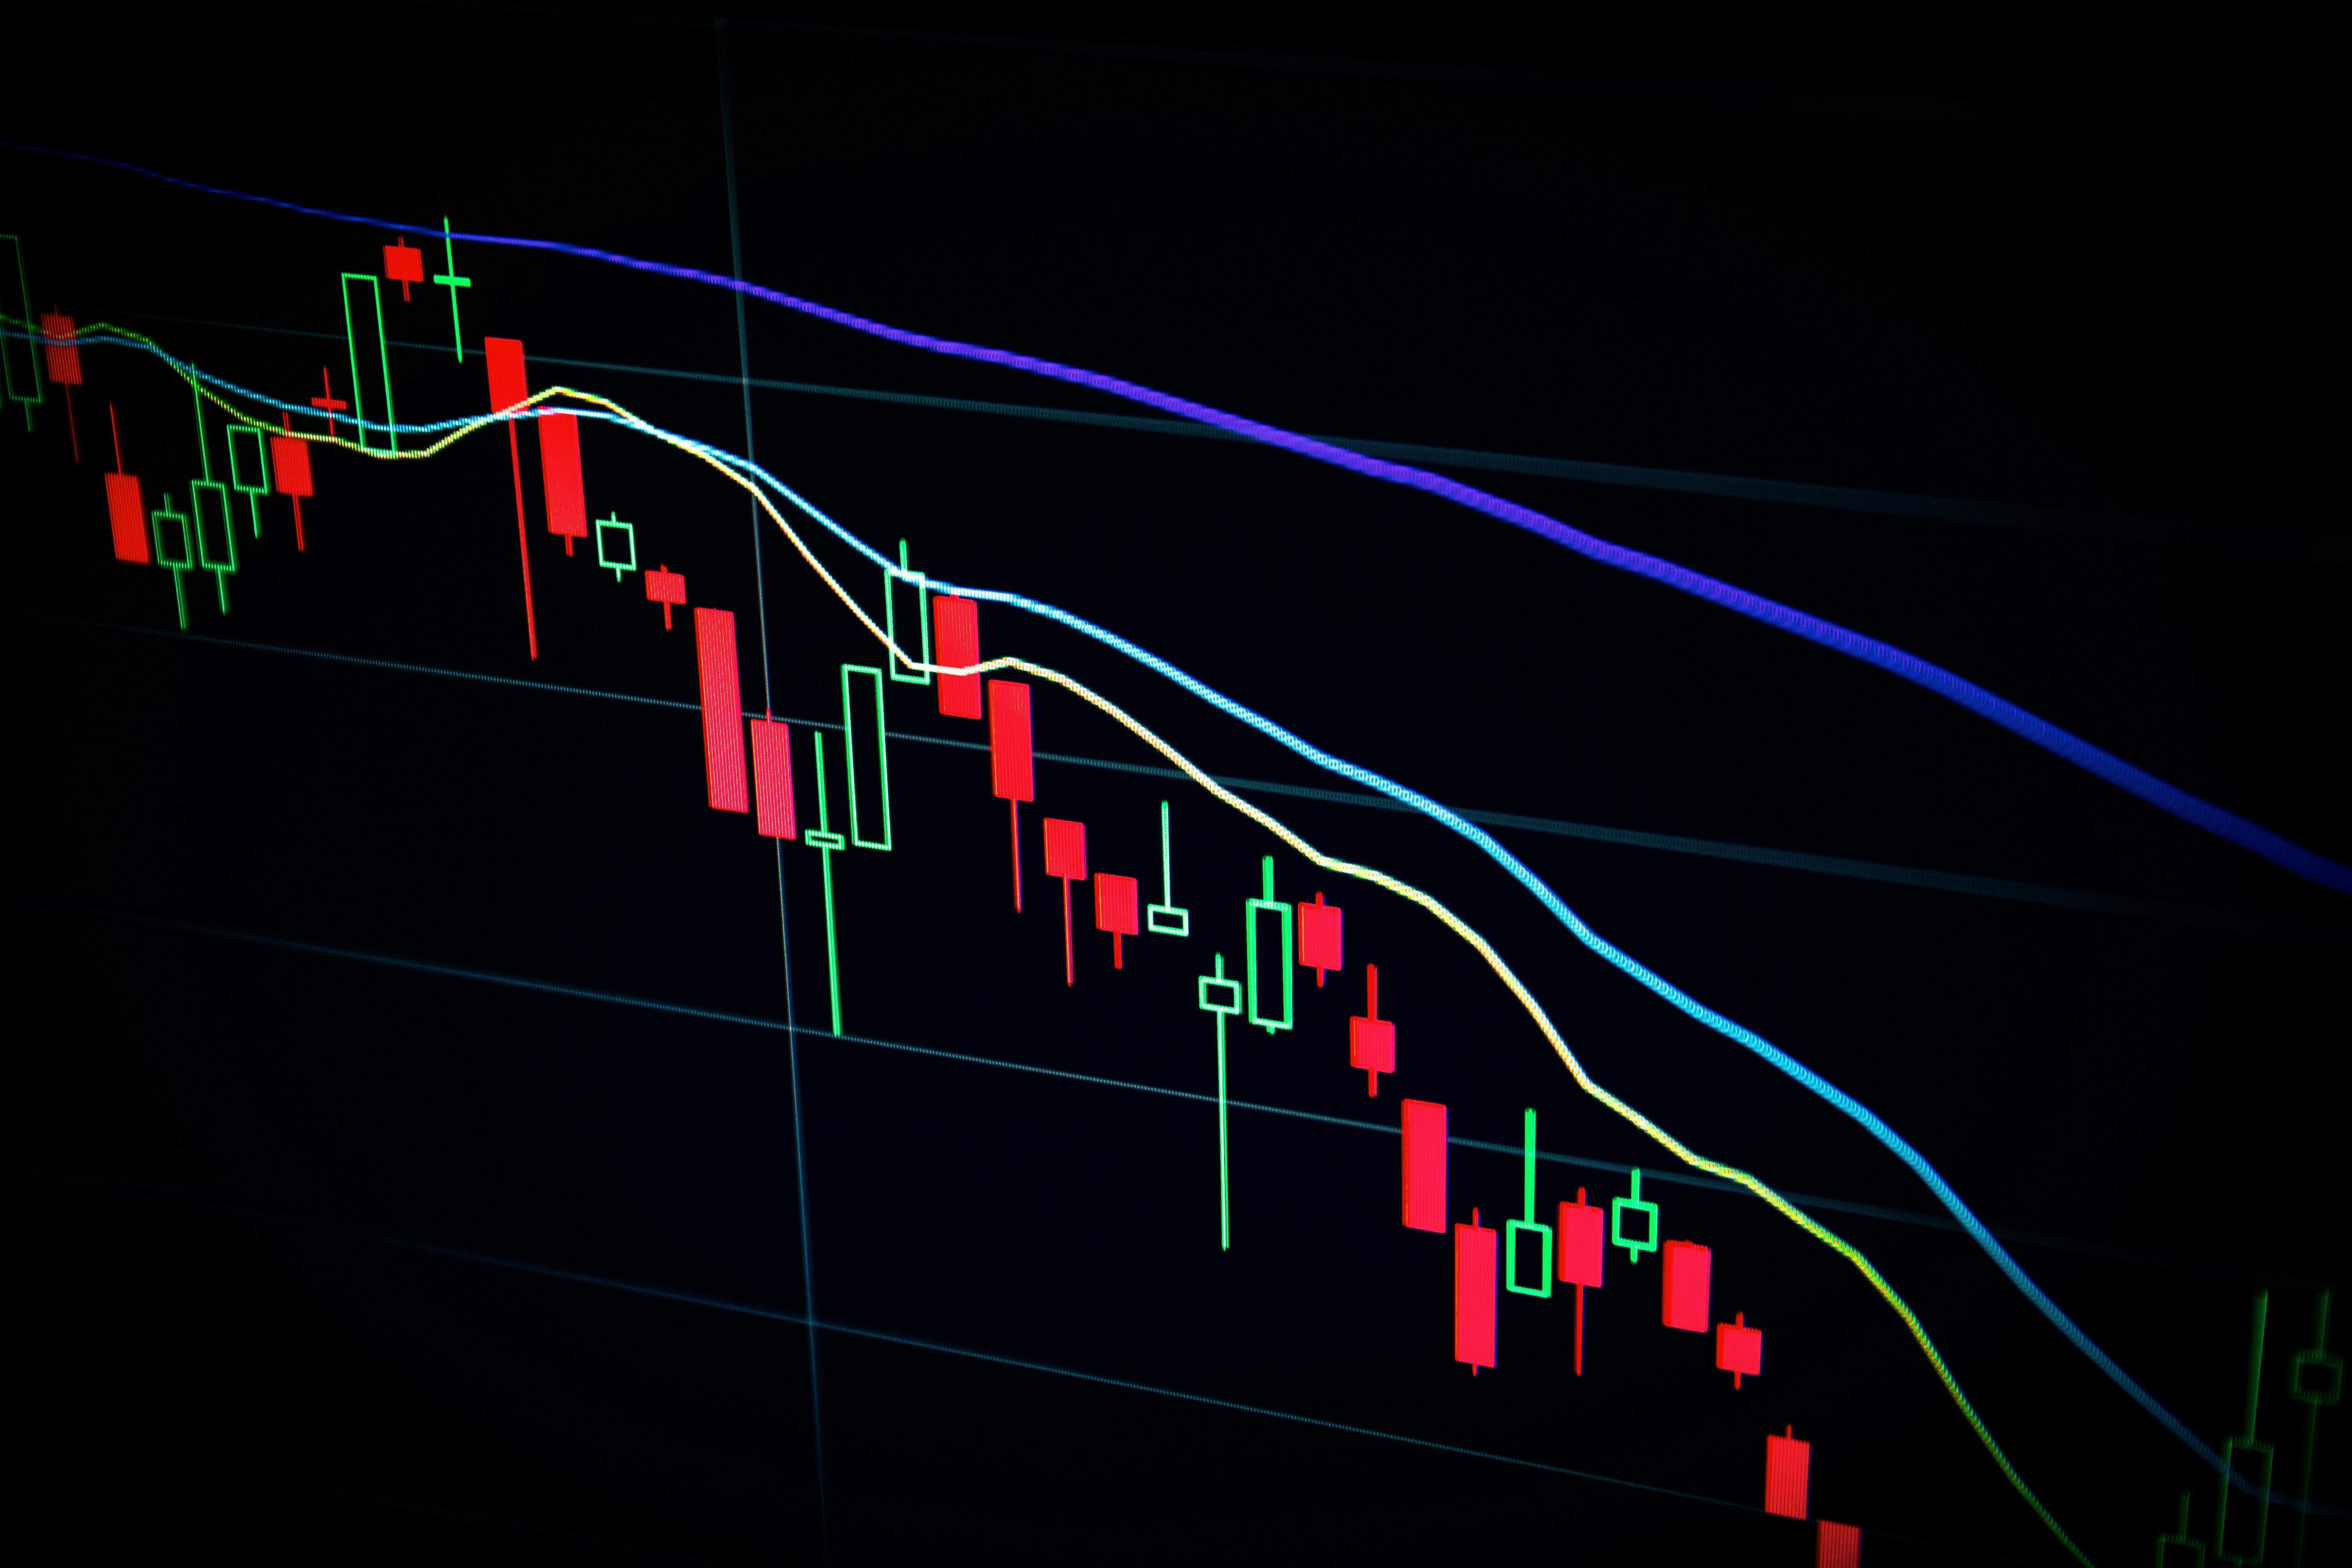
🔍 Candlesticks 101: What Do They Mean?
Most crypto charts use candlesticks to show price movement over time.
- Each candle represents: Open price, Close price, High & Low during that time frame
- 🟩 Green candle = price went up
- 🟥 Red candle = price went down
Example:
1D Chart: Each candle = 1 day of price action
1H Chart: Each candle = 1 hour of trading
🧱 Support and Resistance (The Basics)
Support = a price floor (where buying interest appears)
Resistance = a price ceiling (where selling pressure builds)
Draw these lines on your chart to visualize where price might react.
Example: If BTC keeps bouncing near $60K, that’s strong support.
📏 Popular Indicators You Can Start Using
- ✅ Moving Averages (MA) – Smooths price action; use 50-day MA & 200-day MA. Golden cross = bullish signal.
- ✅ RSI – Relative Strength Index shows overbought (>70) or oversold (<30) conditions.
- ✅ Volume – Measures traded amount; high volume on breakout = reliable move.
🔔 Setting Alerts in TradingView
One of the best features for beginners: alerts.
- Get notified when price hits your target
- Set alerts for RSI levels, breakouts, or crossovers
- Save time — no need to stare at charts all day
Example: “Alert me when ETH hits $3,000 or RSI drops below 30.”
🧠 Final Tips for Beginner Chart Readers
- Start on higher timeframes (1D, 4H) — more reliable than 5min charts
- Don’t rely on one indicator alone
- Combine chart analysis with fundamentals and news
- Practice using a demo portfolio before trading real money